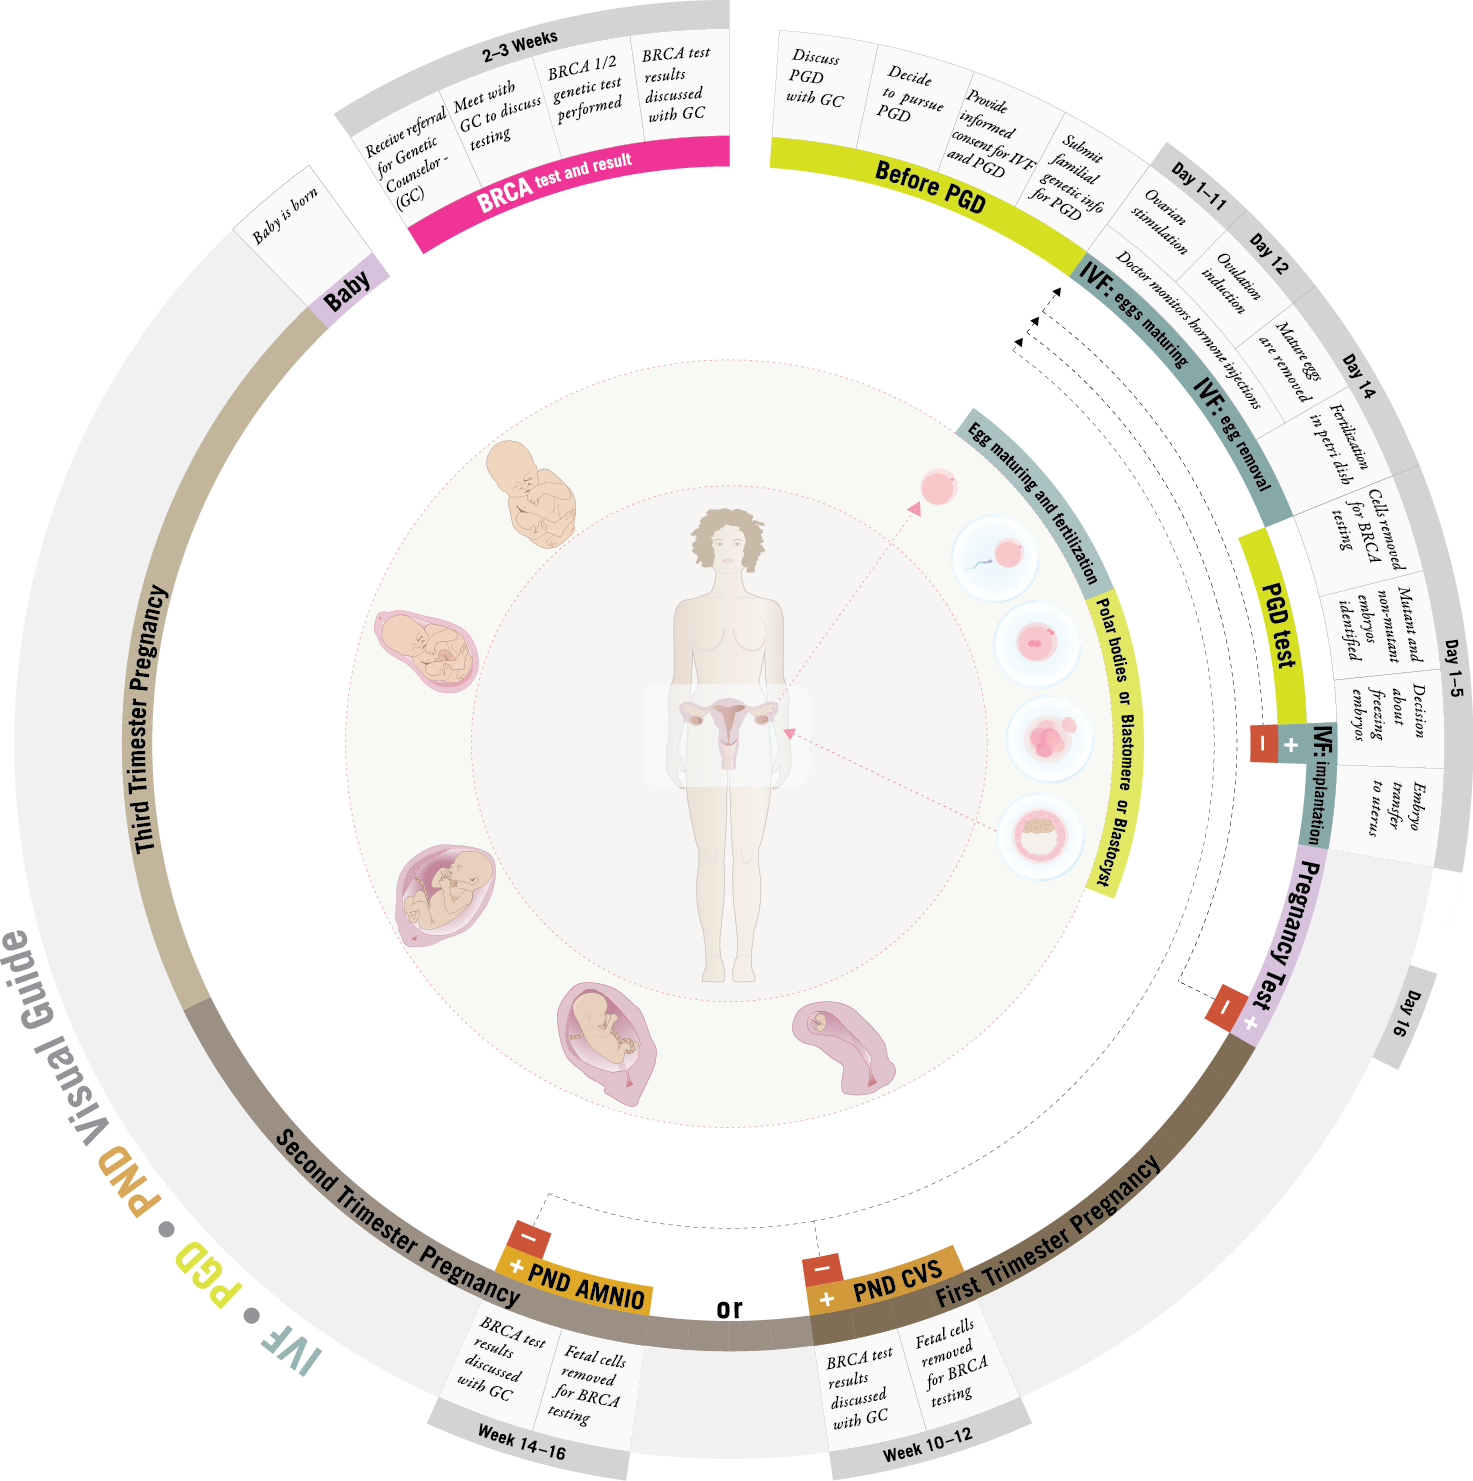
The following graphic represents the different stages of the IVF, PGD, and PND procedures. The outer circle shows the order of the stages, an explanation and the approximate time span.
The inner circle holds a visual representation of the procedure. The "+" in the graphic refers to the procedure being successful; the "-" refers to the procedure being unsuccessful.